fleetster's Poolcar-Analytics
The Analytics feature gives you precious insights to your vehicles’ utilization. Based on the automatically collected data, you can make a better informed decision regarding the size of your fleet or types of your cars.
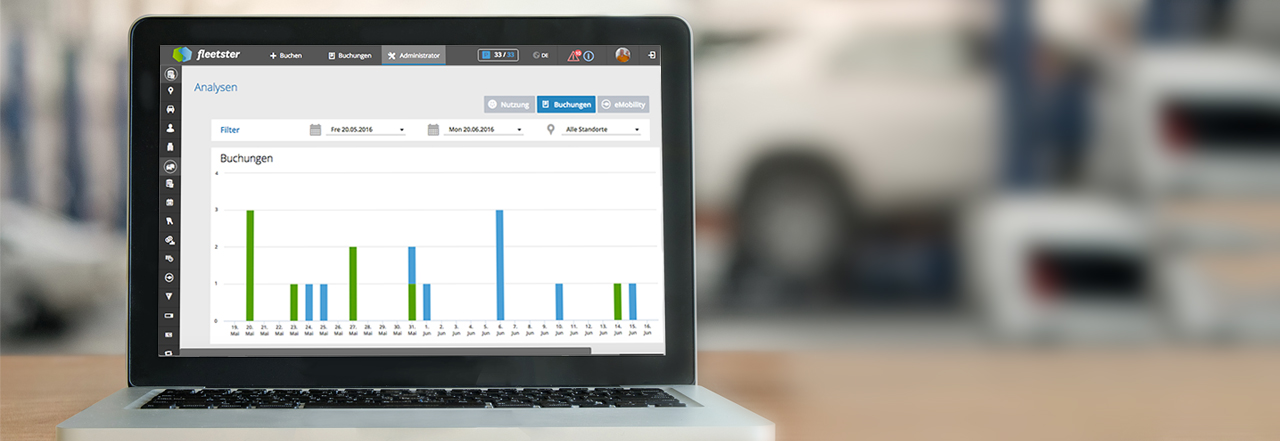
Do your employees book more trips for private or for business reasons? You can find the answer on chart above. If your company does not allow private tips, only the blue (business) and orange (service) bars will be displayed. Tip: In October and April (time for changing summer/winter-tires), the number of service bookings should be increased.

The chart above shows the pool car utilization in the selected period. The dark blue curve shows the total number of cars in the pool, and the light blue bars represent the number of booked vehicles on the specific day.
As the fleet manager, you are able to see how often your vehicles are being used, or if they are needed at all. This will save the company money by releasing any unneeded vehicles in the fleet.

The eMobility-Chart shows how many of your total bookings could have been driven using an electric vehicle. These analytics are very helpful if you are thinking about purchasing an electric vehicle or if you already have one and want to know if its utilization is optimal. The right column in the waterfall chart shows the total amount of your bookings, while the column farthest to the left refers to the electric vehicle bookings. Utilizing the filter on the top left-hand side, you are able to set the range of the electric vehicle in order to find out with how many bookings you could have used an electric vehicle (second column), or which bookings exceeded the range of the electric vehicle.